 Deutsch
 English
 Русский
SendInBlue Email Deliverability Report

Email deliverability for SendInBlue and other providers comparison
| Provider | Emails sent | Emails inbox | Emails spam | Emails lost |
|---|---|---|---|---|
| Brevo | 65.773 | 51.947 (78.98 %) | 12.612 (19.18 %) | 1.214 (1.85 %) |
| Klick-Tipp | 65.791 | 51.708 (78.59 %) | 12.893 (19.60 %) | 1.190 (1.81 %) |
| Sarbacane | 65.975 | 51.577 (78.18 %) | 13.109 (19.87 %) | 1.289 (1.95 %) |
| Postmark | 65.137 | 50.600 (77.68 %) | 13.149 (20.19 %) | 1.388 (2.13 %) |
| Rapidmail | 65.064 | 50.510 (77.63 %) | 13.220 (20.32 %) | 1.334 (2.05 %) |
| MailChimp | 65.936 | 51.160 (77.59 %) | 13.384 (20.30 %) | 1.392 (2.11 %) |
| AWeber | 64.742 | 50.128 (77.43 %) | 13.240 (20.45 %) | 1.374 (2.12 %) |
| SendPulse | 65.413 | 50.605 (77.36 %) | 13.318 (20.36 %) | 1.490 (2.28 %) |
| GetResponse | 65.737 | 50.838 (77.34 %) | 13.485 (20.51 %) | 1.414 (2.15 %) |
| Mailgun | 64.943 | 50.213 (77.32 %) | 13.299 (20.48 %) | 1.431 (2.20 %) |
| SendGrid | 65.240 | 50.398 (77.25 %) | 13.343 (20.45 %) | 1.499 (2.30 %) |
| CleverReach | 65.680 | 50.687 (77.17 %) | 13.479 (20.52 %) | 1.514 (2.31 %) |
| Kit | 65.756 | 50.741 (77.17 %) | 13.544 (20.60 %) | 1.471 (2.24 %) |
| mailtrap | 64.136 | 49.496 (77.17 %) | 13.214 (20.60 %) | 1.426 (2.22 %) |
| MailerLite | 65.886 | 50.829 (77.15 %) | 13.573 (20.60 %) | 1.484 (2.25 %) |
| CampaignMonitor | 65.339 | 50.366 (77.08 %) | 13.501 (20.66 %) | 1.472 (2.25 %) |
| HubSpot | 65.067 | 50.039 (76.90 %) | 13.466 (20.70 %) | 1.562 (2.40 %) |
| ActiveCampaign | 65.698 | 50.460 (76.81 %) | 13.735 (20.91 %) | 1.503 (2.29 %) |
| Mailjet | 65.774 | 50.388 (76.61 %) | 13.836 (21.04 %) | 1.550 (2.36 %) |
| Moosend | 65.471 | 50.135 (76.58 %) | 13.817 (21.10 %) | 1.519 (2.32 %) |
| Benchmark Email | 65.998 | 50.496 (76.51 %) | 13.892 (21.05 %) | 1.610 (2.44 %) |
| Constant Contact | 66.282 | 50.632 (76.39 %) | 13.969 (21.08 %) | 1.681 (2.54 %) |
| Amazon SES | 66.195 | 49.906 (75.39 %) | 14.478 (21.87 %) | 1.811 (2.74 %) |
| Clever Elements | 64.944 | 48.918 (75.32 %) | 14.214 (21.89 %) | 1.812 (2.79 %) |
Preview
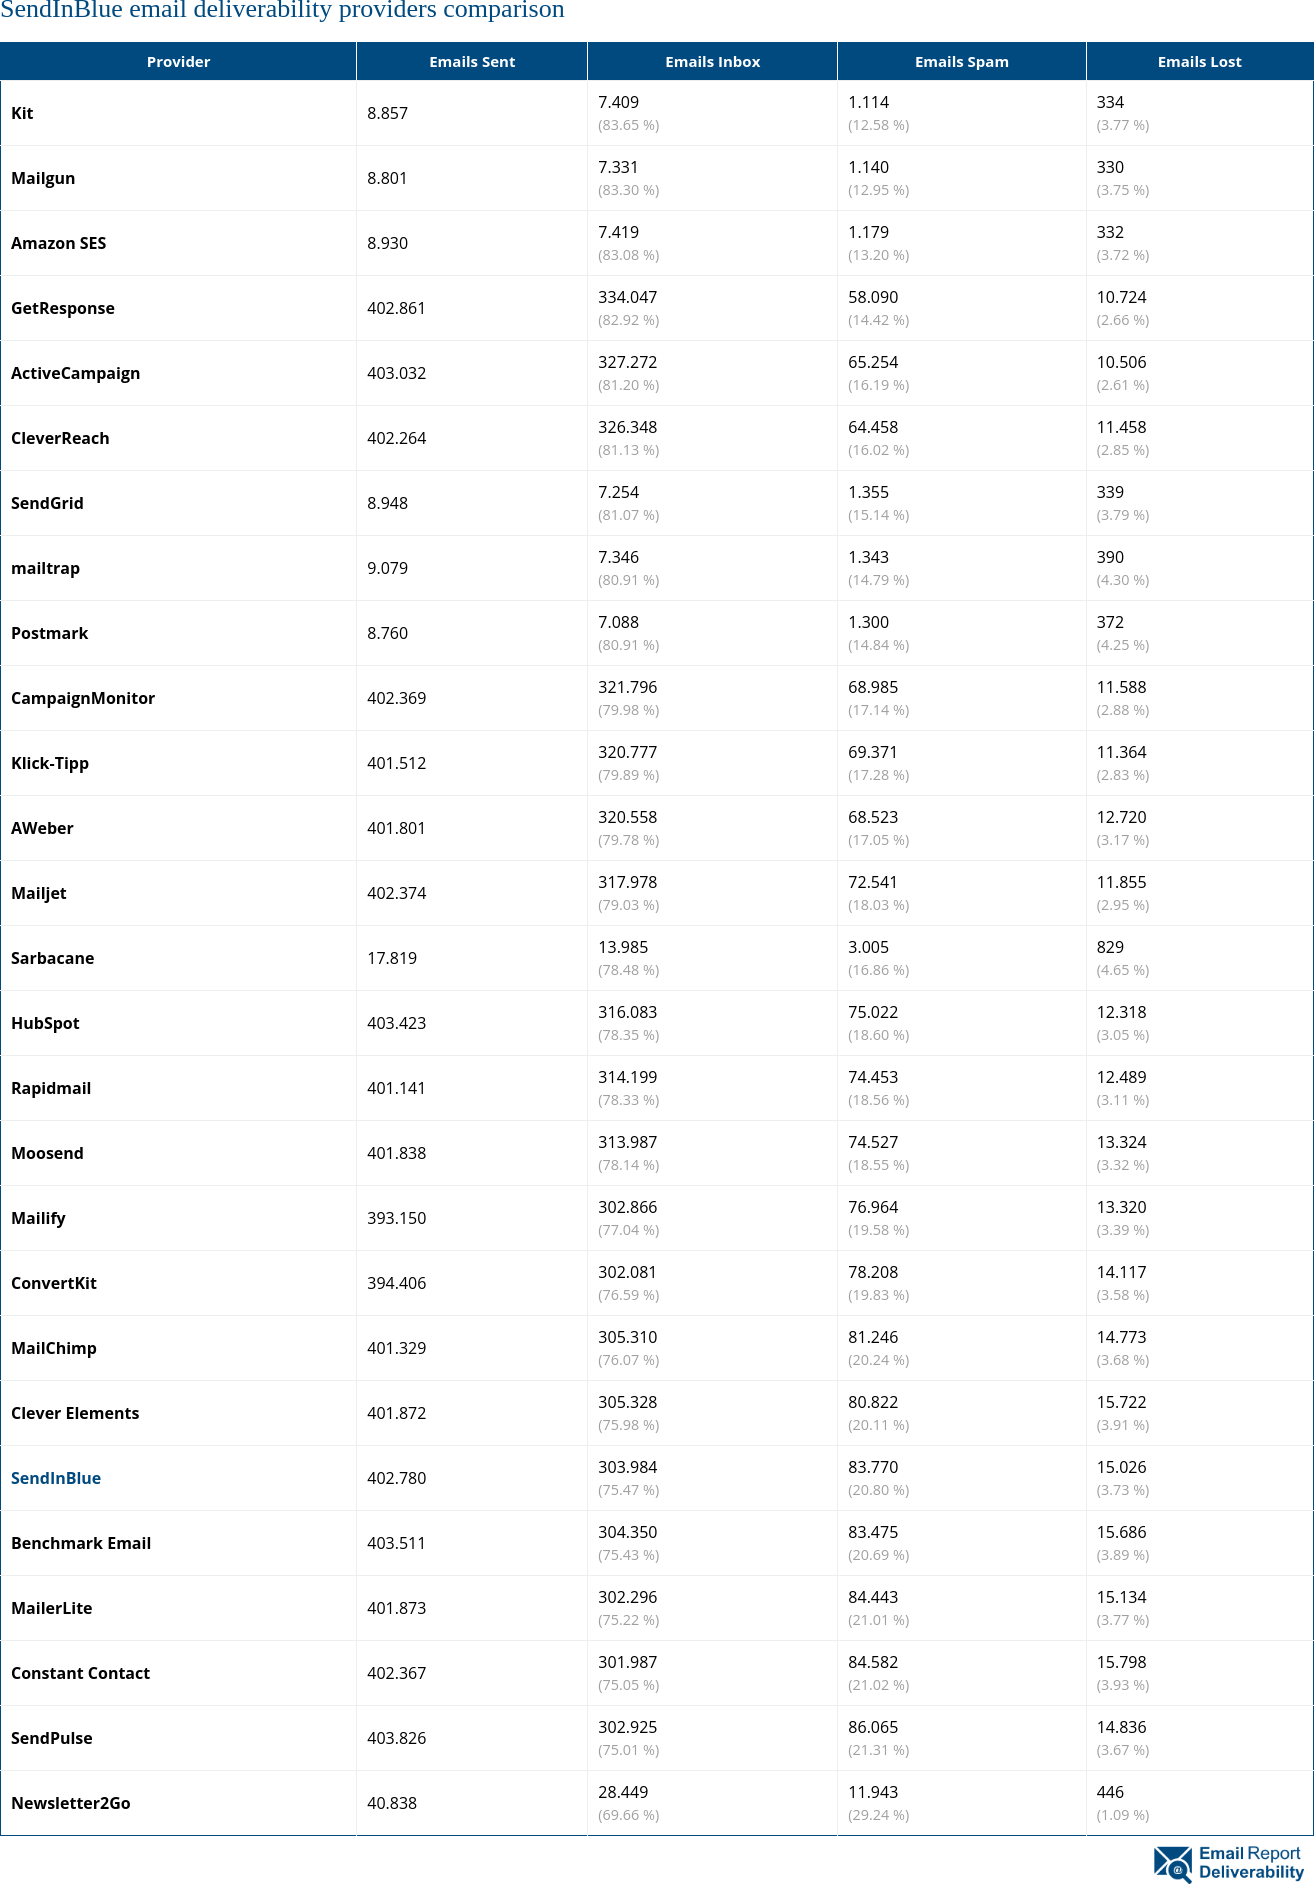
Image URL
Email deliverability rates for SendInBlue and other providers comparison
| Provider | Inbox (%) | Spam (%) | Lost (%) |
|---|---|---|---|
| Brevo | 78.98 % (51.947) | 19.18 % (12.612) | 1.85 % (1.214) |
| Klick-Tipp | 78.59 % (51.708) | 19.60 % (12.893) | 1.81 % (1.190) |
| Sarbacane | 78.18 % (51.577) | 19.87 % (13.109) | 1.95 % (1.289) |
| Postmark | 77.68 % (50.600) | 20.19 % (13.149) | 2.13 % (1.388) |
| Rapidmail | 77.63 % (50.510) | 20.32 % (13.220) | 2.05 % (1.334) |
| MailChimp | 77.59 % (51.160) | 20.30 % (13.384) | 2.11 % (1.392) |
| AWeber | 77.43 % (50.128) | 20.45 % (13.240) | 2.12 % (1.374) |
| SendPulse | 77.36 % (50.605) | 20.36 % (13.318) | 2.28 % (1.490) |
| GetResponse | 77.34 % (50.838) | 20.51 % (13.485) | 2.15 % (1.414) |
| Mailgun | 77.32 % (50.213) | 20.48 % (13.299) | 2.20 % (1.431) |
| SendGrid | 77.25 % (50.398) | 20.45 % (13.343) | 2.30 % (1.499) |
| CleverReach | 77.17 % (50.687) | 20.52 % (13.479) | 2.31 % (1.514) |
| Kit | 77.17 % (50.741) | 20.60 % (13.544) | 2.24 % (1.471) |
| mailtrap | 77.17 % (49.496) | 20.60 % (13.214) | 2.22 % (1.426) |
| MailerLite | 77.15 % (50.829) | 20.60 % (13.573) | 2.25 % (1.484) |
| CampaignMonitor | 77.08 % (50.366) | 20.66 % (13.501) | 2.25 % (1.472) |
| HubSpot | 76.90 % (50.039) | 20.70 % (13.466) | 2.40 % (1.562) |
| ActiveCampaign | 76.81 % (50.460) | 20.91 % (13.735) | 2.29 % (1.503) |
| Mailjet | 76.61 % (50.388) | 21.04 % (13.836) | 2.36 % (1.550) |
| Moosend | 76.58 % (50.135) | 21.10 % (13.817) | 2.32 % (1.519) |
| Benchmark Email | 76.51 % (50.496) | 21.05 % (13.892) | 2.44 % (1.610) |
| Constant Contact | 76.39 % (50.632) | 21.08 % (13.969) | 2.54 % (1.681) |
| Amazon SES | 75.39 % (49.906) | 21.87 % (14.478) | 2.74 % (1.811) |
| Clever Elements | 75.32 % (48.918) | 21.89 % (14.214) | 2.79 % (1.812) |
Preview
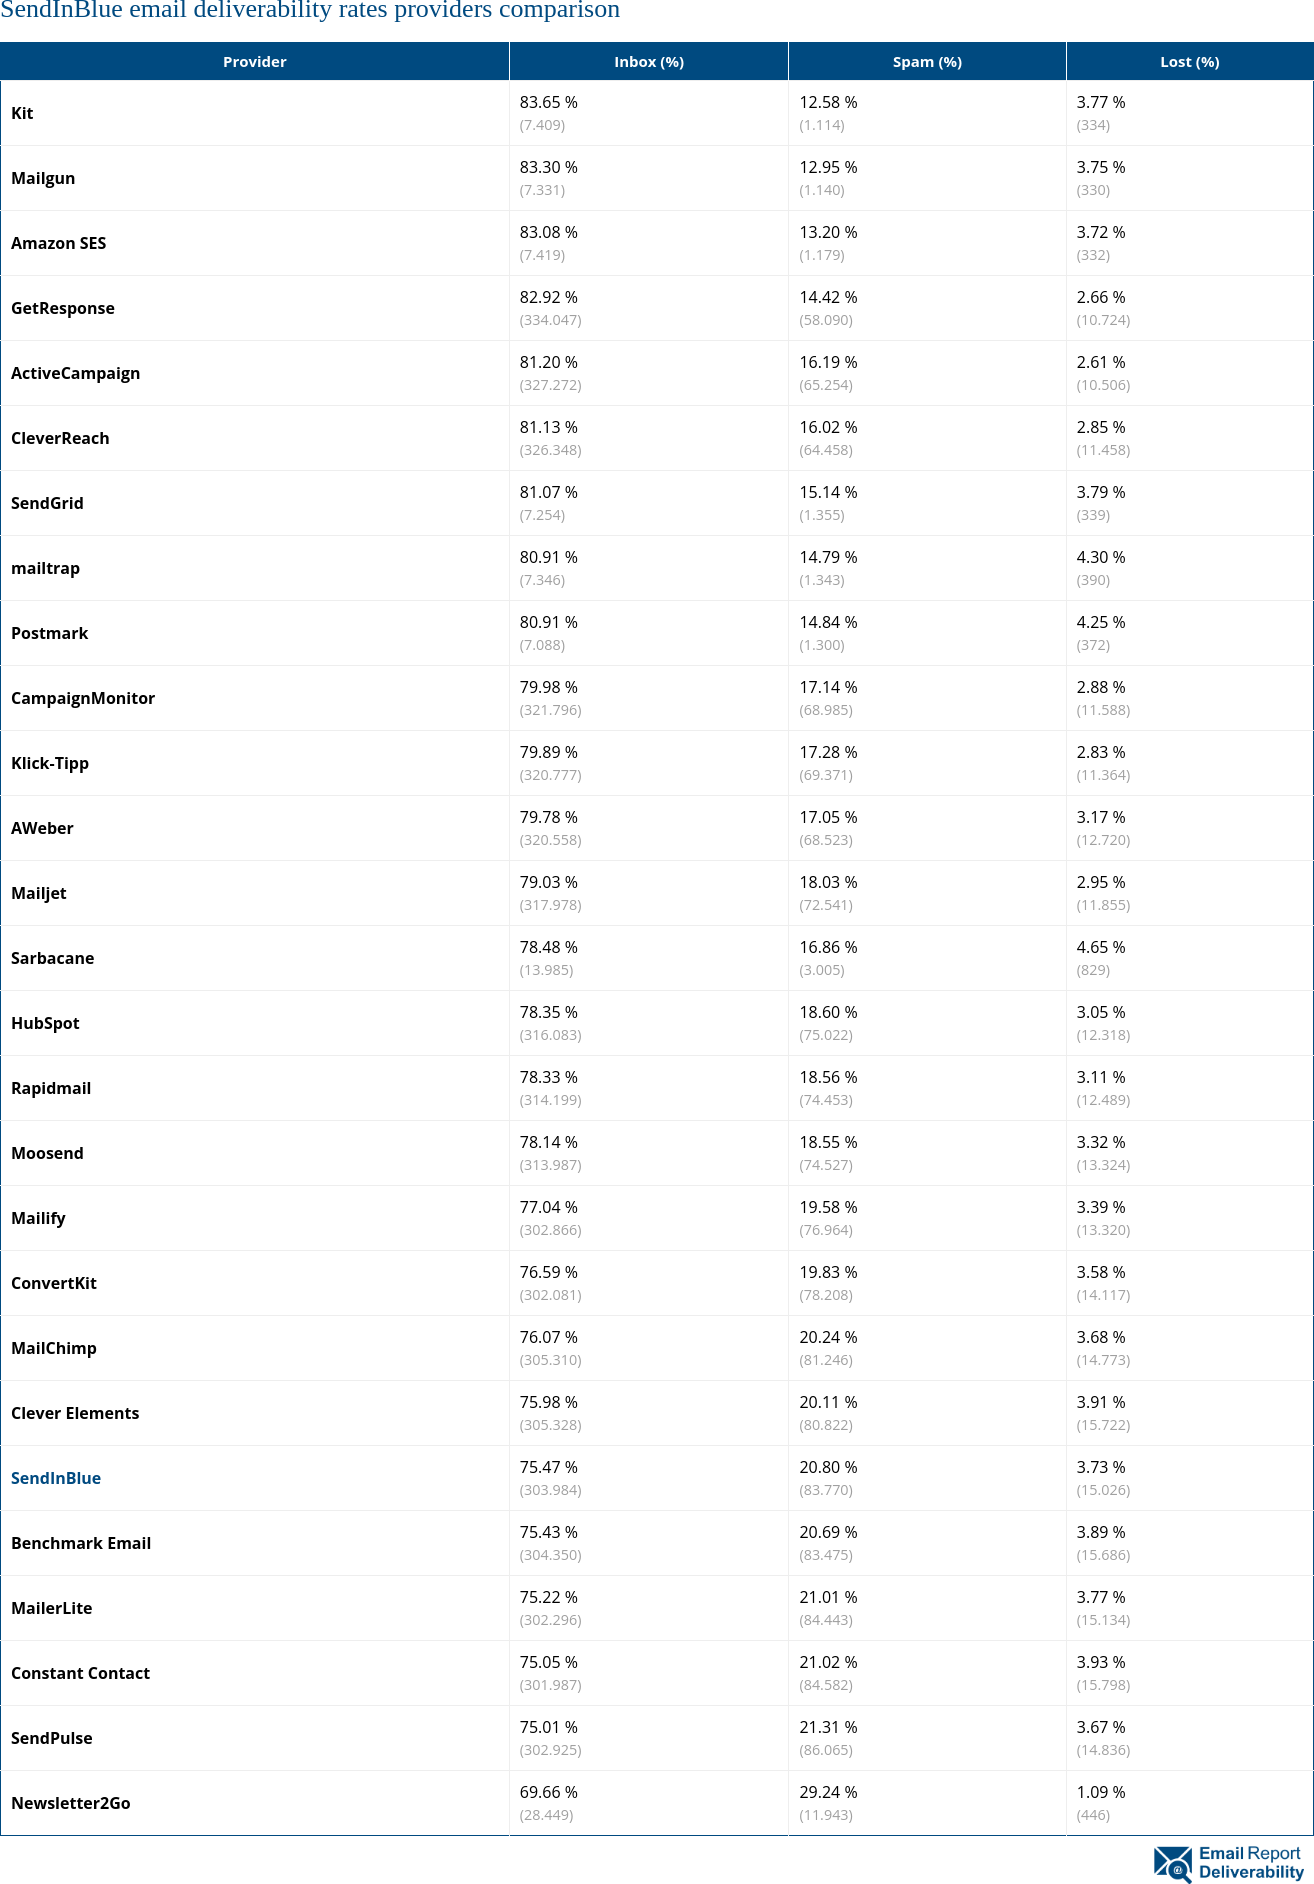
Image URL
Email deliverability by category
Not enough data to show a table.
Preview

Image URL
Email deliverability by email service provider
Not enough data to show a table.
Preview
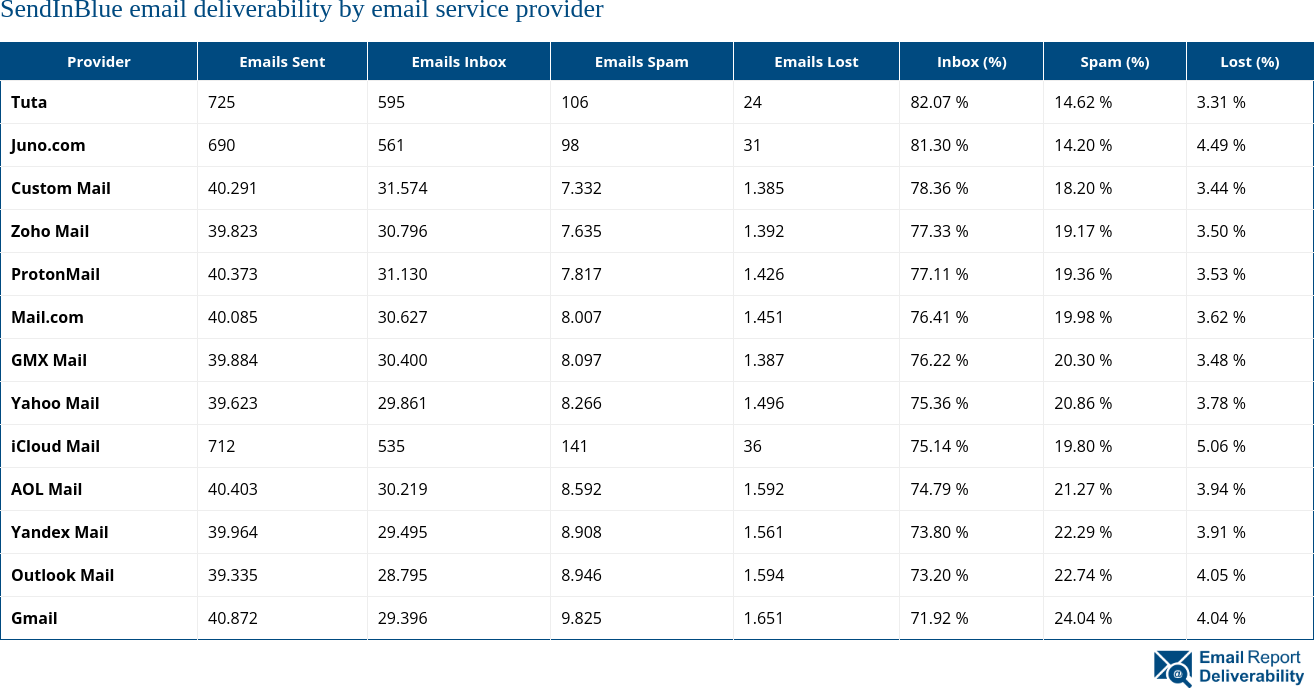
Image URL
SendInBlue badges for website
The following badges for SendInBlue can be embedded into a website.
SendInBlue
80
/100
SendInBlue
80
/100
SendInBlue
80
/100
References and Resources
Further resources and references for SendInBlue.
No references or resources found.